Case study
Quarterly profit sharing, built on the accounting system
A Charlotte roofing contractor replaced a quarter-end spreadsheet with a tool that calculates every payout from job data and gives each person a clear statement.
Value to the client
- Cost reduction
- 160hrs / yr
- of quarter-end spreadsheet work
- Our estimate
- Risk mitigation
- 672
- crew payouts a quarter, each traced to the job that earned it
- Measured
Our estimate assumes about 40 hours a quarter to build and check the profit-sharing spreadsheet by hand.
Managing Director
3 min read
At a glance
- Client
- Not named
- Location
- Charlotte, North Carolina
- Industry
- Commercial roofing
Systems connected
Sage 300Job revenue, cost, and labor
Profit-sharing tool
Calculated every quarter
- Team statementsOne for each person
- Payout reportReady for payroll
Hours back every quarter, and a report the team actually reads
- Crew payouts in a quarter
- 672
- Calculated from job data, no spreadsheet
- Traceable payouts
- Every job
- From job profit to each person's share
- A statement for each person
- Quarterly
- Tied to the jobs they finished
- Data refresh
- Nightly
- From the accounting system
Before
A quarter-end spreadsheet everyone depended on
Hours each quarter pulling job data and reconciling it by hand.
The logic lived in one workbook, and few people could check it.
Team members got a number they couldn't trace to the jobs they worked.
What we did
A tool that does the quarter's math and shows everyone their share
Trace the calculation
Rebuilt the workbook step by step: job profit, margin, rate, pool, and each role's share.
Connect the data
Job revenue, cost, and labor load nightly from the accounting system.
Build the tool
Every pool shows its math. Rates are versioned, so a paid quarter never changes.
Verify
Matched a quarter already paid by spreadsheet, to the cent, before go-live.
What we built
The quarter, and what each person earned
Leadership sees the pool and every job behind it. Each person sees their share.
- Pool this quarter
- $48,920
- Jobs closed
- 14
- People paid
- 57
Pool by quarter ($k)
| Job | Profit | Margin | Rate | Pool |
|---|---|---|---|---|
| 24-118 Distribution center reroof | $190,500 | 31.1% | 10.0% | $19,050 |
| 24-131 Medical office TPO replacement | $84,500 | 29.5% | 8.5% | $7,183 |
| 24-140 School district roof coating | $46,200 | 26.4% | 7.0% | $3,234 |
| 24-152 Retail center repairs | $21,400 | 22.2% | 5.0% | $1,070 |
Pool = margin-bracket rate × job profit, split by role, then by person. Every figure traces to the accounting system.
Q3 2026 statement
Superintendent, Team 3
Your share from the jobs you finished this quarter.
- 24-118 Distribution center reroof$1,524
- 24-131 Medical office TPO replacement$575
- 24-140 School district roof coating$259
Paid with the October 31 payroll.
Related insights
Case study
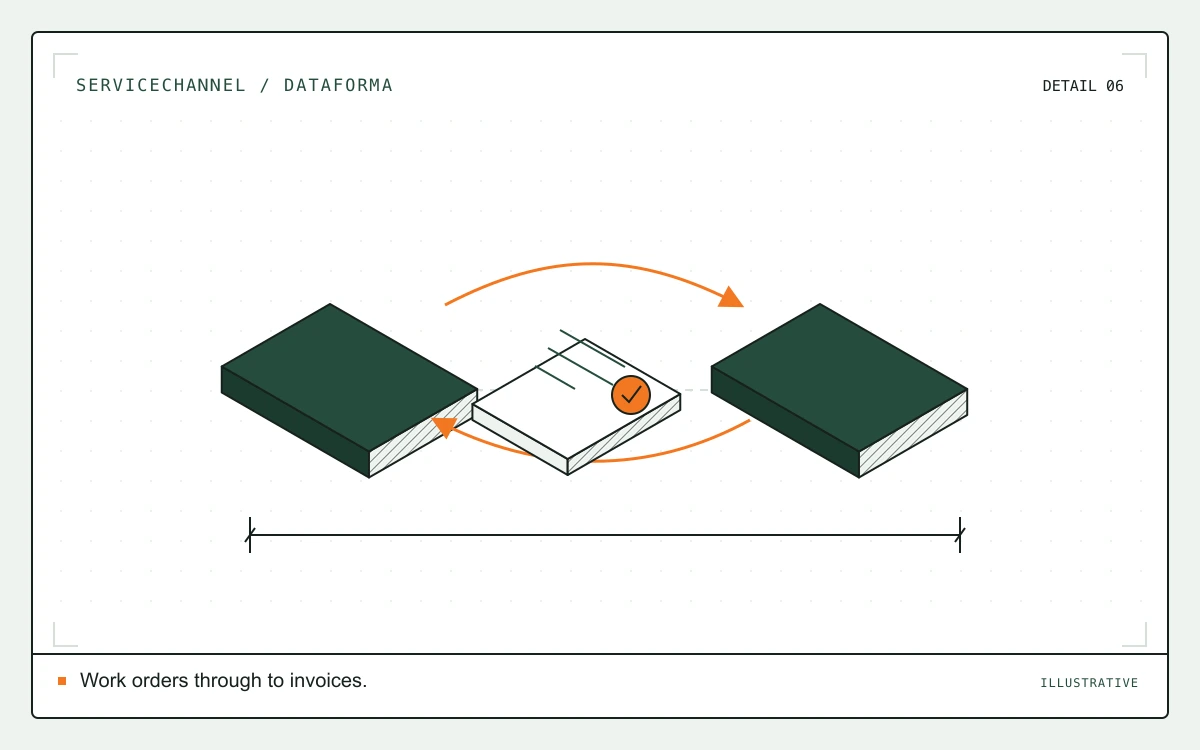
Two-way ServiceChannel and Dataforma integration: 2,000 hours of data entry a year
October 2026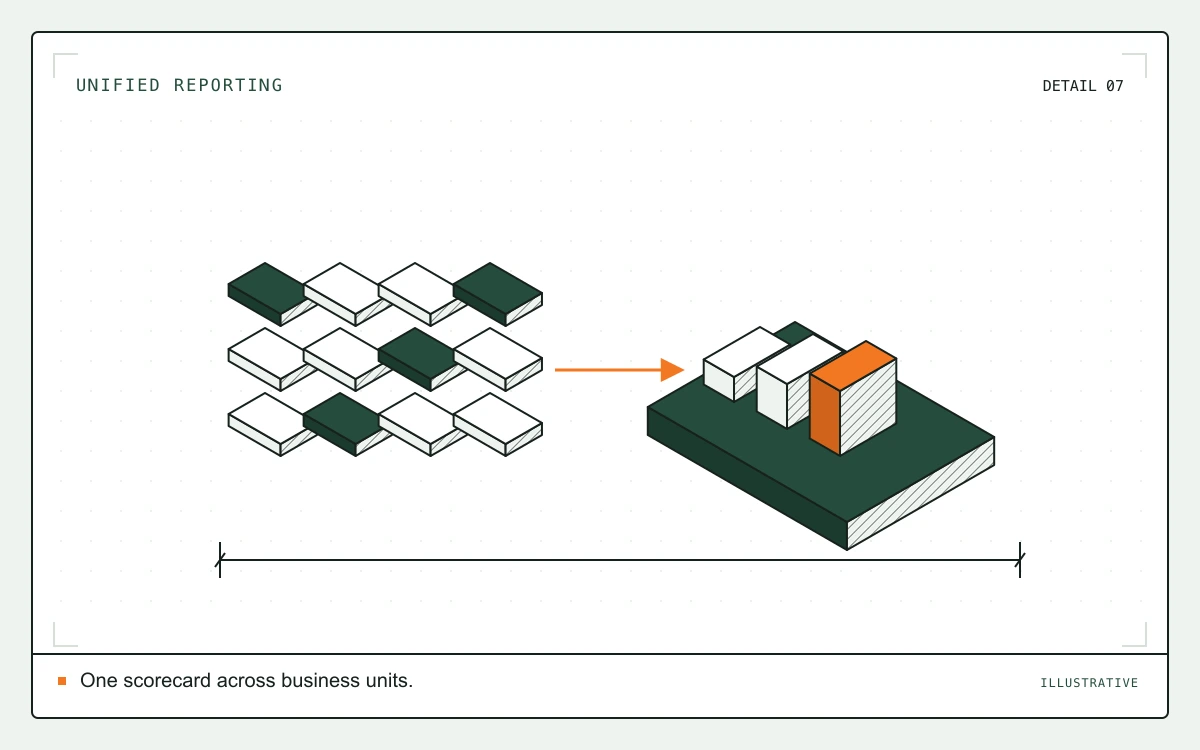
Case study
One scorecard for 13 roofing business units
January 2026
Working through a similar problem?
Talk through your operations with us and we'll agree where to start.